
Answers to 6 top questions about the Sarasota/Manatee County Real Estate Market
Scott Norris November 23, 2023
Scott Norris November 23, 2023
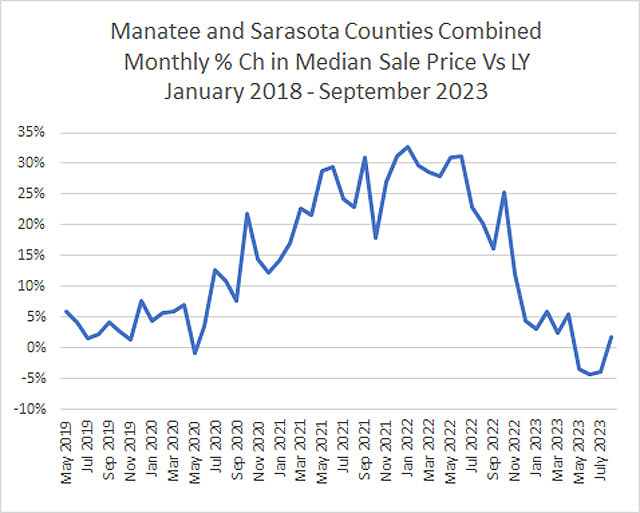
Single family home sales prices in October 2023 were up .1% compared to last month and down 8.3% compared to October 2022. Condominium sales prices in October were up 4.1% compared to last month and up 3.7% compared to October 2022.
Compared to their respective monthly high median sales prices, the October median sales price of $499,500 for single family homes was about 8% off the high of $543,000 reached in April 2023. For condominium sales, the median sales price of $392,500 was only slightly under the high reached in May 2023 of $394,000.
There is a caveat to assuming that the changes in the median sales price are a good proxy for appreciation. The median sales price (or any sales price) only tells you what consumers are paying for something. It doesn't speak to what they are getting. The assumption is that, as a group, home buyers are buying homes that are roughly the same as the homes that were purchased last year. However, if people are spending the same or slightly more and getting considerably more home than buyers did last year (bigger, newer, better location, etc), then home prices could be falling even though the median price is stable or even rising. That aside, the median sale price is about the only readily available tool we have to evaluate how home prices are moving.
Sales in October were about 3% higher than October 2022. In fact, sales last month were higher than every month from October 2022 to February 2023. If your home or condo was listed last month and priced under $500,000 you should have had an easier time than average selling your home. Thats because homes priced under $500,000 accounted for 60% of all sales even though that same group amounted to only 51% of the total number of homes on the market.
.
So far this year, 45% of all sales have been all-cash sales. For sale prices under $500,000, 41% have been all-cash sales. The 5-year average has been 43% for all-cash sales and 40% all-cash sales for sale prices under $500,000. So, you have around 40%-45% chance of selling for all cash and the higher your sales price the more likely you are to get an all-cash offer. The percentages have not changed materially over time (i.e. things were about the same in the pre-pandemic years).
Before the pandemic, the median days on market floated around between 45 and 60 days. During the year May 2021- May 2022, the number crashed to 4-6 days. This year, the monthly median DOM has ranged from 15-31 days. In October, the median days on market was 23 days. So, things are not selling as fast as 2021-2022 but still faster than would generally be considered normal.
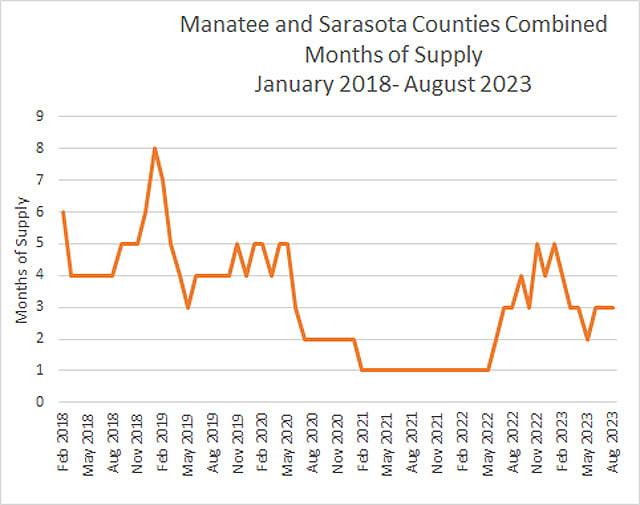
October ended with 6,932 residential properties listed for sale. That is the most since April 2022, effectively the first month of the pandemic. However, the number of properties for sale is still well below any month prior to May of 2020 going back at least to January 2017. In summary, inventory is still light compared to historical norms but steadily growing.
For all months between April 2021 and June 2022, the median close-to-asking-price ratio was at or above 100% (over half of all sales occurred at or above full price). For the seasonal months, the ratio exceeded 101%.
This year, things have normalized. The median sale price/list price spread has ranged from 96.8% to 97.7%. So, in general, expect to take a 2%-3% haircut from your asking price in order to sell.

Sarasota/Manatee County Home Prices
Sales Levels at New Low

Sarasota/Manatee County Home Prices
New Construction Sales hit 10 Year High
Sarasota/Manatee County Home Prices
Median Sales Price down 3% vs September 2022
Sarasota/Manatee County Home Prices
Up 5% SInce Beginning of Year

Starting in July 2021, year-over-year monthly sales turn negative due figures spurred by the pandemic.

If 2021 and 2022 had never happened, this would have been considered a great month.

An increase in the number of expired listings is a sign that actual home values are less than expectations.
Get assistance in determining current property value, crafting a competitive offer, writing and negotiating a contract, and much more. Contact me today.


